Below you will find pages that contain the key word “Python”:
AI Agents for Automated Quality Assurance
Quality Assurance (QA) is an intensive endeavour that feels very repetitive to humans. In this article, we explore the potential of using Agentic AI to automate this process. In particular, we’ll apply this methodology to a real-world example: ensuring that parallellm.com (the “target website”) runs smoothly, round the clock. Any issues that do arise will be flagged very quickly.
The application of Agentic AI to QA has great potential, since traditional website scanning is notoriously difficult. Their HTML layouts are liable to change at any moment. AI Agents, when set up in the right way, can tolerate such changes, whereas traditional heuristic rules are hard-coded and brittle against this effect.
XKCD Finder
XKCD comics have become a cornerstone of internet culture, particularly in technical circles, with their witty takes on science, programming, and mathematics. However, finding the perfect XKCD for a particular topic or reference can be challenging - there are now over 3,000 comics in the archive, and traditional search methods rely heavily on exact keyword matches or remembering specific comic numbers.
This project explores how modern Natural Language Processing (NLP) techniques can be used to search XKCD comics semantically, understanding the underlying meaning rather than just matching keywords. By applying vector embeddings and Retrieval Augmented Generation (RAG) to comic descriptions, we can now perform a search based on concepts, themes, and abstract ideas.
Parallellm Pump
Large Language Model (LLM) tools, such as ChatGPT and DeepSeek, have become a key part of people’s workflow, in professional and everyday usage. However, there are dozens of different providers now offering a myriad of options all at different price points; even a single provider has a multitude of models to choose from.
So where do you begin? The Parallellm Pump offers developers a power tool for making response comparisons, asynchronously, to let you be the judge of which provider returns the best result. Still not sure? You can even ask the LLMs themselves to make the decision for you!
DeepSeek in the Cloud
In this post, I will share my experiences of running one of the DeepSeek open-weights models (DeepSeek-R1-Distill-Qwen-32B) directly on AWS hardware in the cloud - no need for API tokens.
The good news is that it’s easier than you think - modern libraries, such as PyTorch and the Hugging Face (🤗) transformers package, facilitate much of the heavy lifting. I found some extra tips and tricks along the way to speed things up and I will share these with you in this post.
Let it Segment: A Gift from SAM
With the release of the Segment Anything Model1 (SAM) released by Meta AI Research last year, the lie of the land changed quite substantially in Computer Vision, as now images could be segmented easily, with great results even zero-shot. With the release of SAM22 earlier this year, I wanted to get hands on and experiment with these models myself.
This post walks you through how SAM2 could be used in practice, provides a mini analysis of segmentation results and will be released with code so that you can explore further if you want to. This could be expanded to interesting use cases, such as facilitating object grasping in robotic systems, branded product addition or removal in marketing images, or mapping changes in forested areas from satellite imagery over time for environmental monitoring.
Construction Timelapse
In this project a stunning timelapse video was created from an image stock of over 3,000 photos of a construction site, tracking the progress of a new residential building from breaking ground to completion, a process lasting more than three years. Those images were taken without a tripod, so the variability in camera positions and angles was of course high. To correct for this, Computer Vision techniques were used to predict key points in the images, that could then be used to straighten them and produce the final, steady timelapse.
Heatmap Analysis
This is an article I wrote for Verv during their Seedrs fundraising campaign in March 2024. Link to article.
This January, we finished the installation of the first Verv Smart Isolator with our partner Nido, a Spanish heat pump provider. A Verv Smart Isolator was attached to an air-to-water heat pump and in less than a week, we provided actionable insights for the customer.
One of the tools that helps us understand the energy usage patterns is the energy-utilization heatmap. The heatmap visualizes the hourly energy consumption over different days (vertical axis) and times of day (horizontal axis). The intensity of colour - marked in the legend - represents the energy expenditure during each hour, with darker colours indicating higher usage.
Parkrun Map
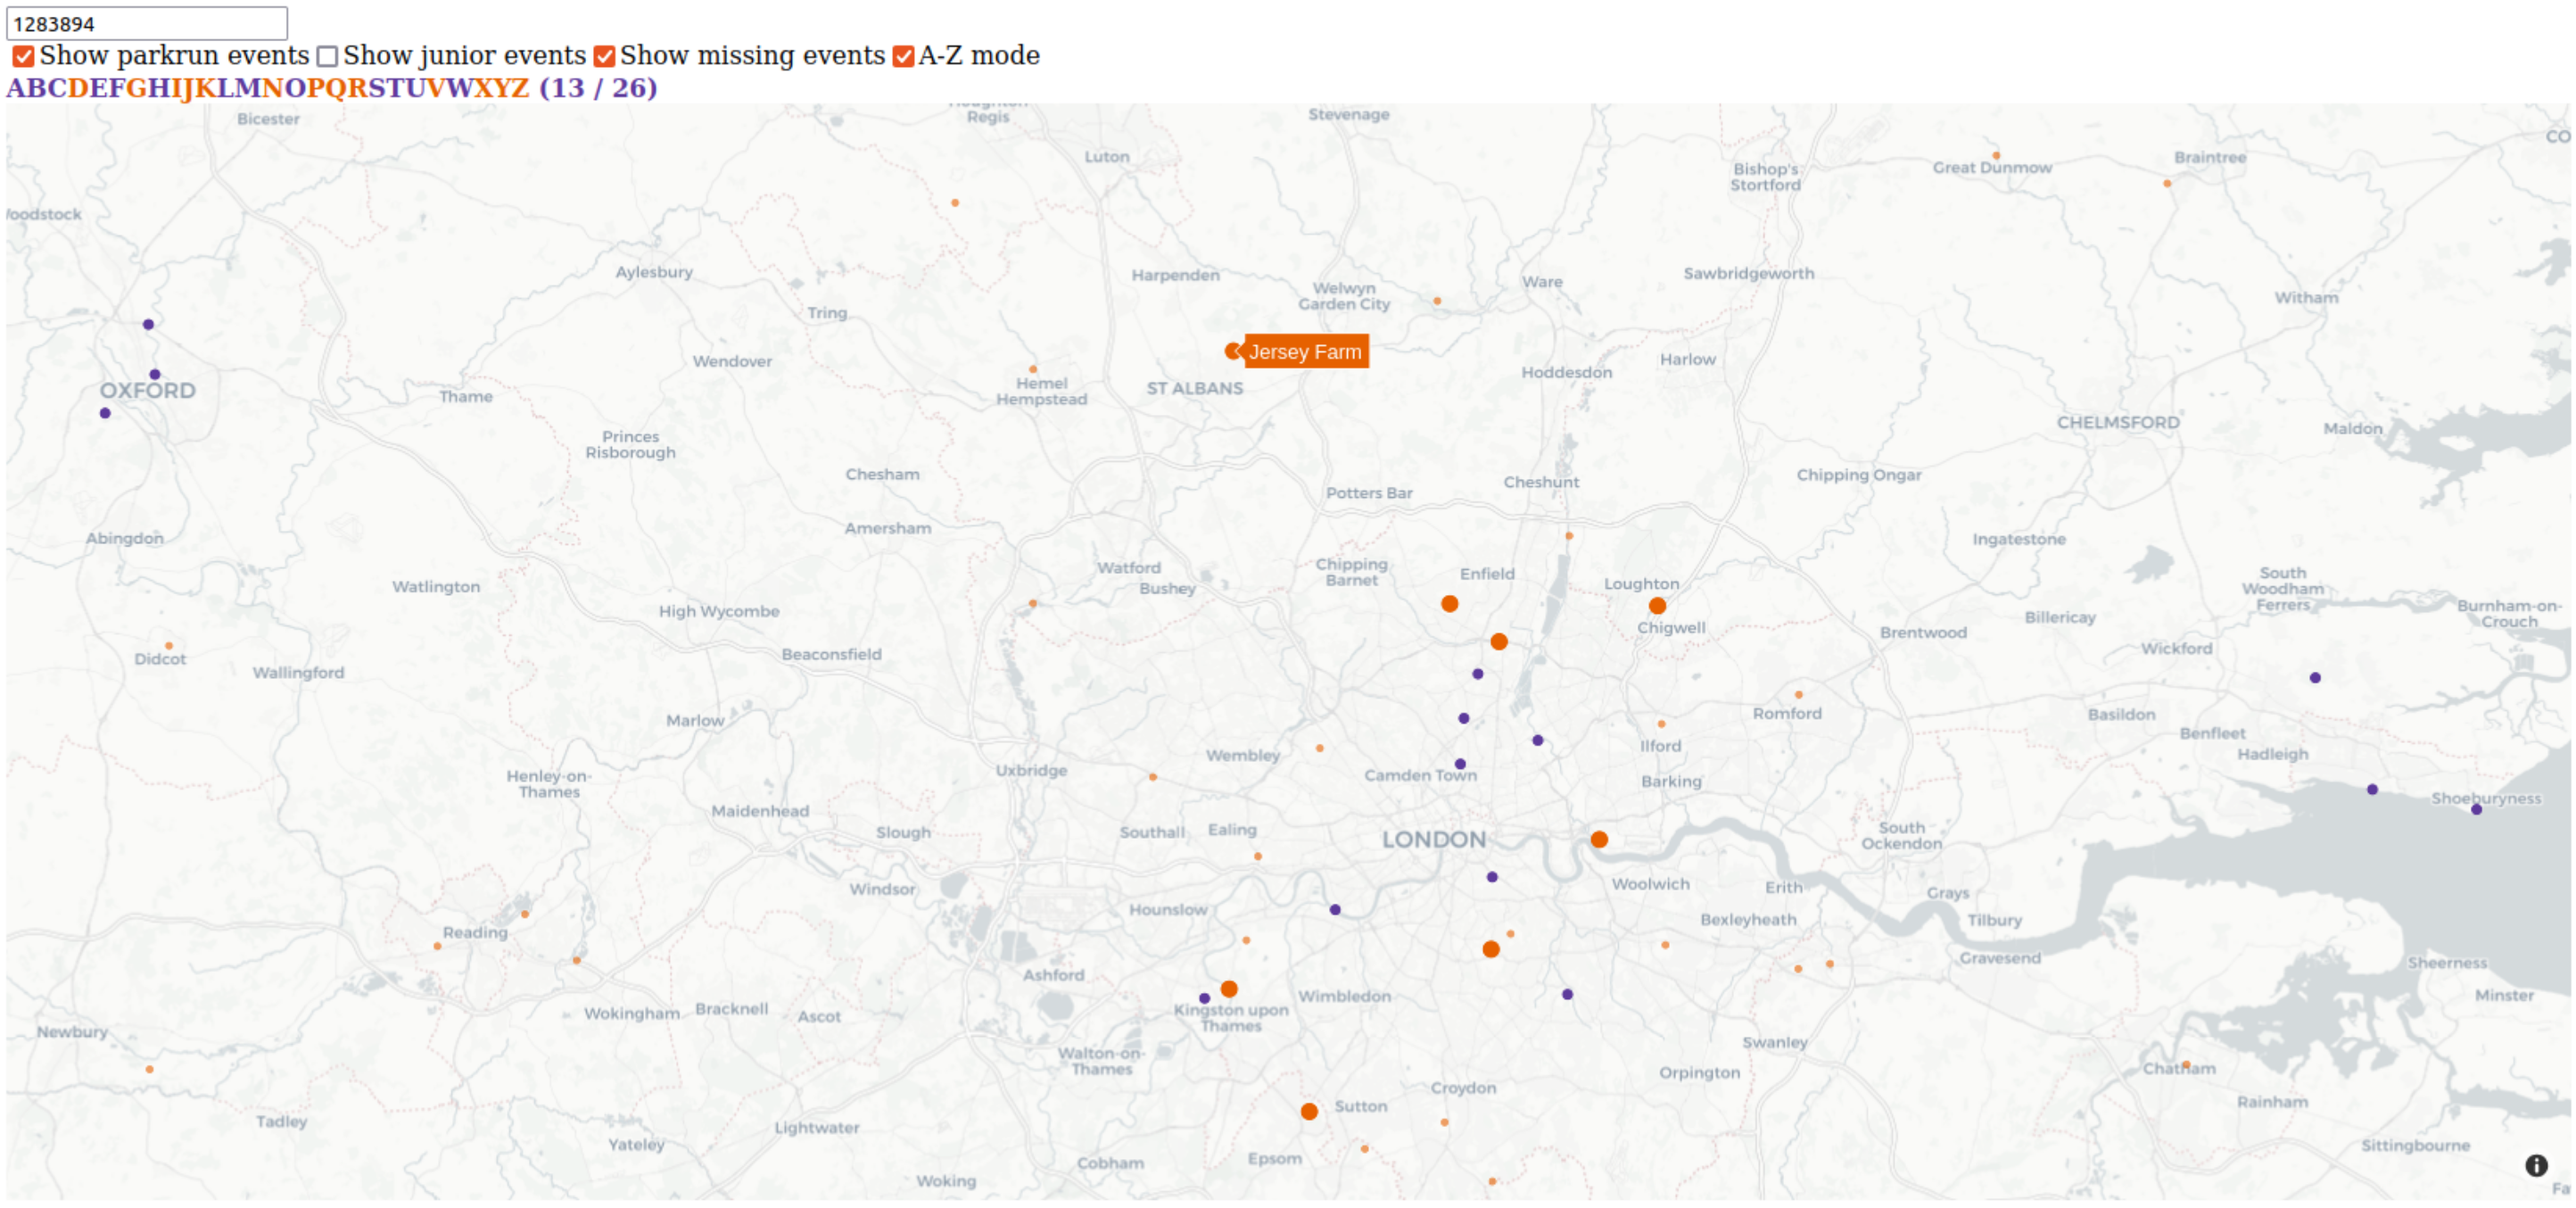
Like to parkrun? I certainly do! This project helps you to visualize where you’ve been running, and where you could go next. Simply run the app locally with Python, and enter an athlete ID (e.g. your own one).
I’ve used Plotly Dash to render the parkrun participation on a map for a given athlete. The map initially starts out centred on your home parkrun course - the one you’ve visited most - just zoom out if you’ve gone farther afield.
Image Selector
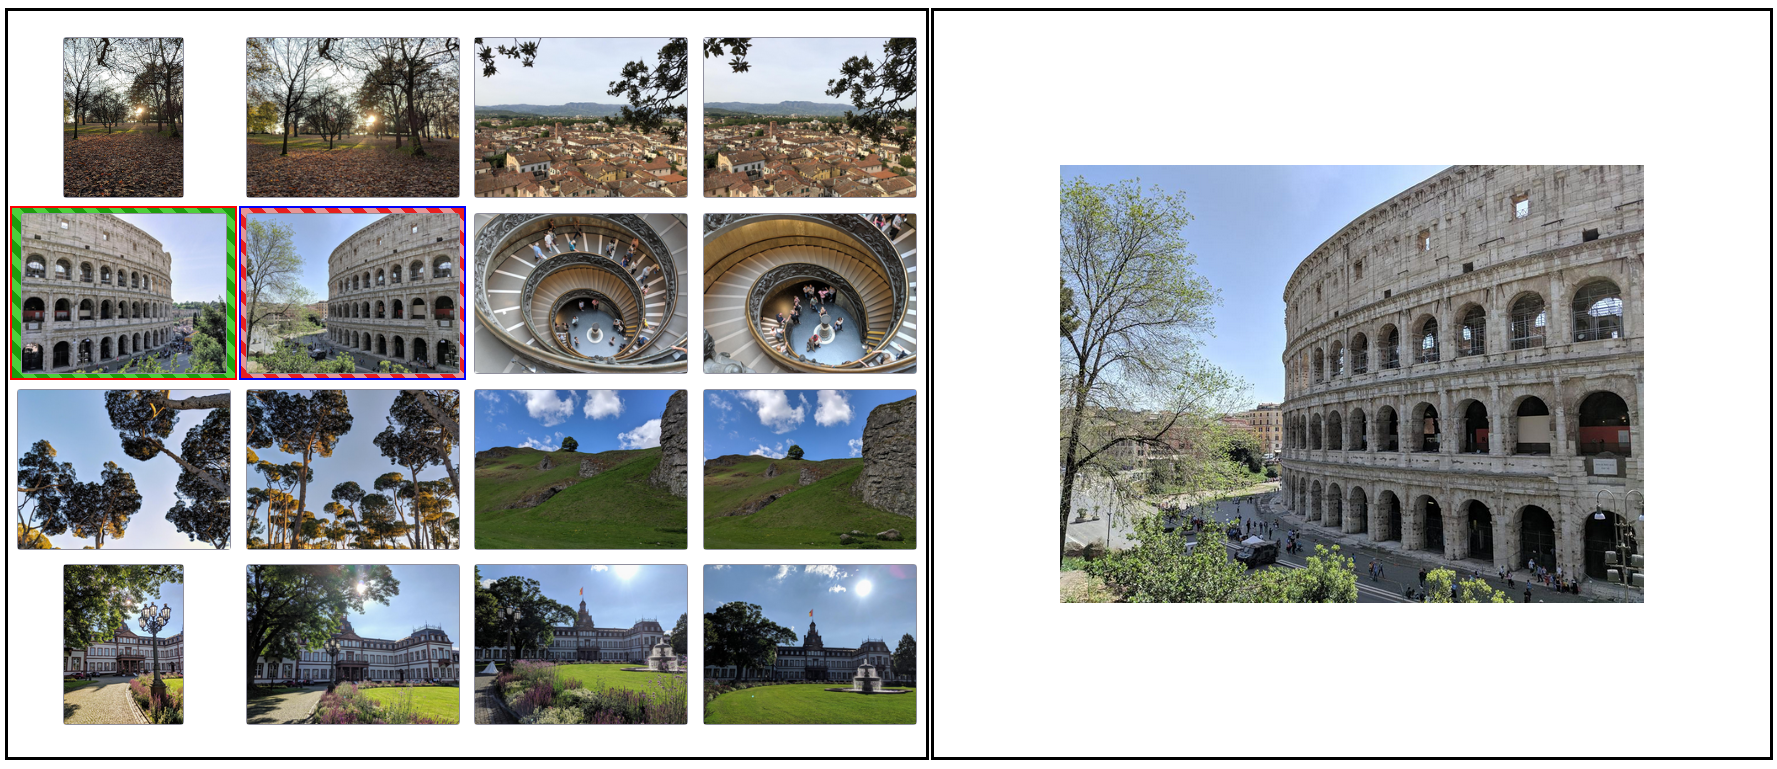
Duplicate photos are annoying and unwanted. Wouldn’t you rather make those post-holiday rundowns with the family as impressive (short) as possible? The burden of boiling your photo set down to the most memorable and ones with the best angle is greatly reduced by this app. It works because you can visualize all images together in the order they were taken.
I now use my Dash app routinely after every holiday, as it makes the deduplication process much faster, yielding a cleaner set of photos without maxing out your hard drive!
Atari Pong
This is a short post to describe my practical introduction to Reinforcement Learning (RL), where I trained a simple agent to play the classic Atari game Pong via a Deep Q-Network.
In English, this means we teach a novice computer to play the classic paddle game by allowing it to observe what happens when it performs various movements at different times and stages of gameplay (against the same, fairly strong opponent). Then, after making a sequence of movement choices, our agent either gets a point (reward of +1) or loses one (reward of -1). After a lot of trial and error, the agent will have observed enough situations to learn what is a good move to make at a given moment in the game.
Find Tune
The objective of this project is to create a program that listens to a continuous stream of sound and identifies when a particular song - the target track - is playing. This is similar to how home assistants such as Amazon’s ‘Alexa’ function, except they seek out a different sound (their name). Ultimately, this project will be used to replay the detected positive sound to a speaker, serving as a doorbell amplifier.


